|
|
Common Vision Blox 14.0
|
|
|
Common Vision Blox 14.0
|
Common Vision Blox Foundation Package-Tool

The DrawGraph Control provides a convenient and straightforward way of displaying data buffers of many different data types in form of a graph.
The DrawGraph Control was mainly designed to display the data computed by a LightMeter Control. Different from other tools on the market, which are designed to display buffer data created by programs like Excel in a variety of different chart styles, the DrawGraph Control is optimized for the belongings of image processing. The priority in the design of the tool was speed rather then a great variety of graph styles which would not be used in an image processing application anyway.
The DrawGraph Control which is shipped with the LightMeter Control can be used to display results generated by the LightMeter Control in a very straightforward way.
DrawGraph is available as part of the CVB Foundation Package.
The DrawGraph Control's basic idea is to display the contents of any data buffer in form of a point chart or bar chart.
As an input the tool needs one ore more data buffers, the number of entries in each data buffer and the size of a single data buffer entry. When the control is executed it scales the included buffer entries to fit into the drawing window of the DrawGraph Control.
The scaling of the buffers is depending on the selected scale mode.

DrawGraph is available as ActiveX Control only.
In addition to the standard properties dialog you can select and change most properties in the Property Pages of DrawGraph Control. This is a convenient way to setup the tool.
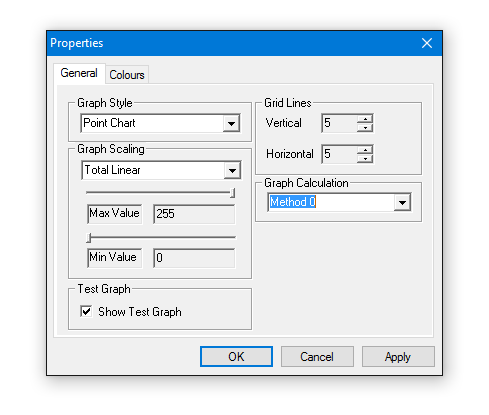
The General Property Page of a DrawGraph Control
The General page of the DrawGraph Control allows you to change the properties online and have a direct feedback of this changes.
The DrawGraph.ocx can be found here.
Tutorials using DrawGraph are to be found under %CVB%Tutorial\LightMeter.
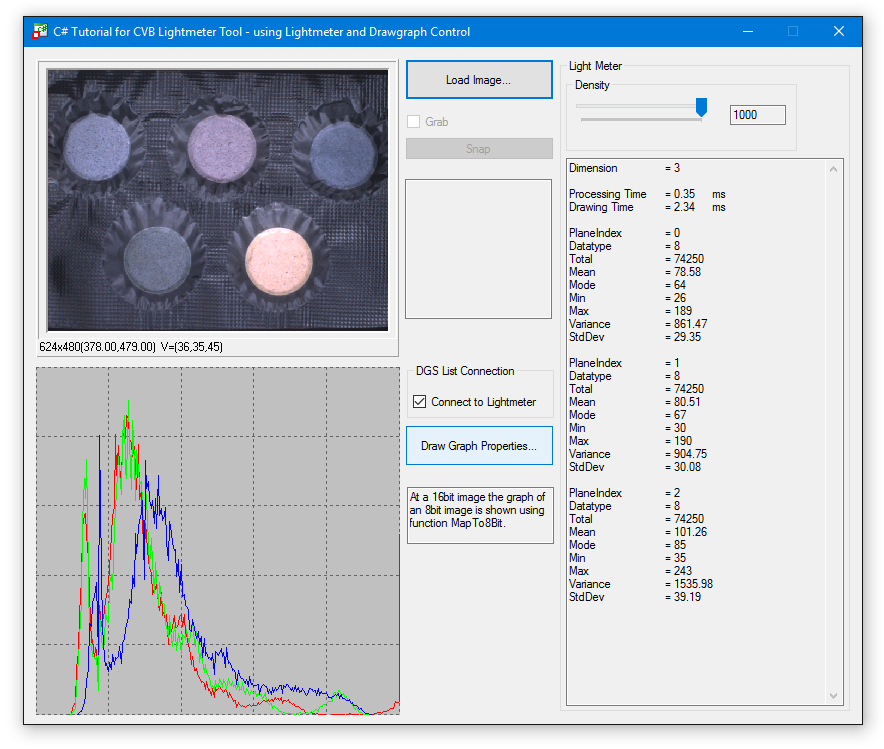
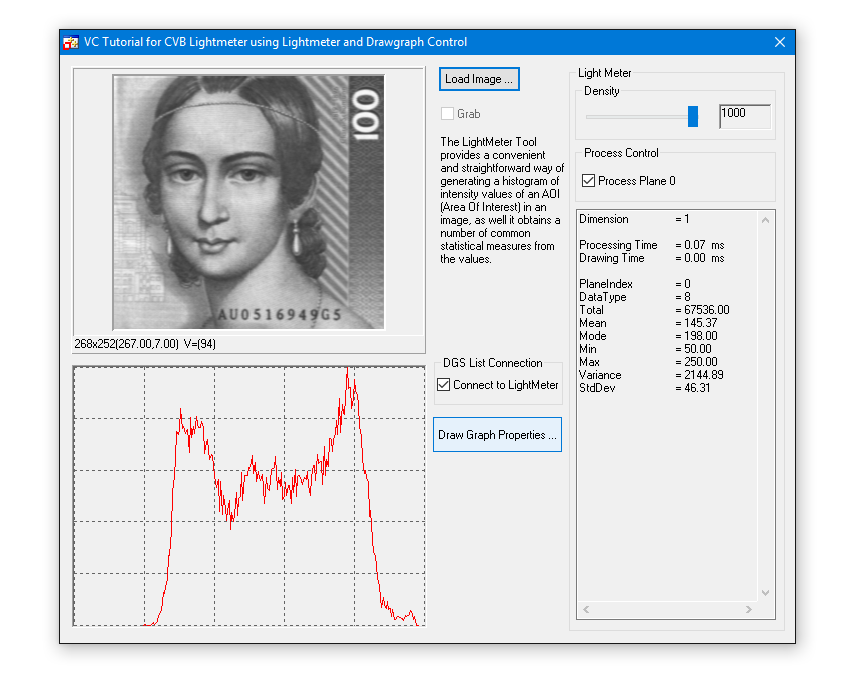
The following image shows an example application the DrawGraph Control can be used for: