|
|
Common Vision Blox 14.0
|
|
|
Common Vision Blox 14.0
|

Common Vision Blox Foundation Package Tool
 C-Style |  C++ | ") .Net API (C#, VB, F#) |  Python |
| LightMeter.dll | Stemmer.Cvb.LightMeterLib | cvb.foundation |
The LightMeter Tool
Furthermore the Tool can be used for adjusting the threshold and other important parameters of additional tools (e.g. Edge Tool, or Blob Tool ... ) used for the inspection task. This speeds up the process of determining and optimizing the correct system settings tremendously.
The DrawGraph Tool which is shipped with the LightMeter Tool can be used to display results generated by the LightMeter Tool in a very straightforward way (please refer also to the DrawGraph Tool Tool documentation). The LightMeter Tool is available as a Control (OCX) for fast application programming as well as a dynamic link library (Dll). The DrawGraph Tool is available as Control only. The LightMeter Tool is available as part of the CVB Foundation Package.
The LightMeter Tool functionality is mainly based on computing the histogram of an AOI of an image. The following figure shows a typical histogram plot with several points of interest indicated. In the plot the pixel intensity value is plotted along the X axis while the frequency of occurrence of those intensity values is plotted along the Y axis.
A typical image histogram
The histogram data is used to calculate further statistical values of interest. Following statistical values (SVxxx where SV marks a Statistical Value) are provided by the tool:
The total number of pixels in the AOI used for computing the histogram. This value is depending on the size of the AOI and the Density property of the LightMeter Tool (refer to the Common Vision Image Manager documentation to learn more about the density value).
The arithmetic mean of all histogram values.
The intensity value that occurs most often in the histogram. If there is more than one value that occurs most often the smaller intensity is returned.
The smallest intensity value in the histogram.
The largest intensity value in the histogram.
The variance or mean square deviation.
The variance formula
The standard deviation computed as the square root of the variance. This is easier to use for make further calculations then the variance.
The number of pixels with a intensity value between a lower and a upper limit.
LightMeter Control Pixel statistic values can be used in very simple applications to detect part or feature presence/absence. This is achieved by examining the grey value statistics (histogram) of an image region:
In addition to the standard properties dialog you can select and change most properties in the Property Pages of LightMeter Control. This is a convenient way to setup the tool. In addition you can set Draw Graph properties.
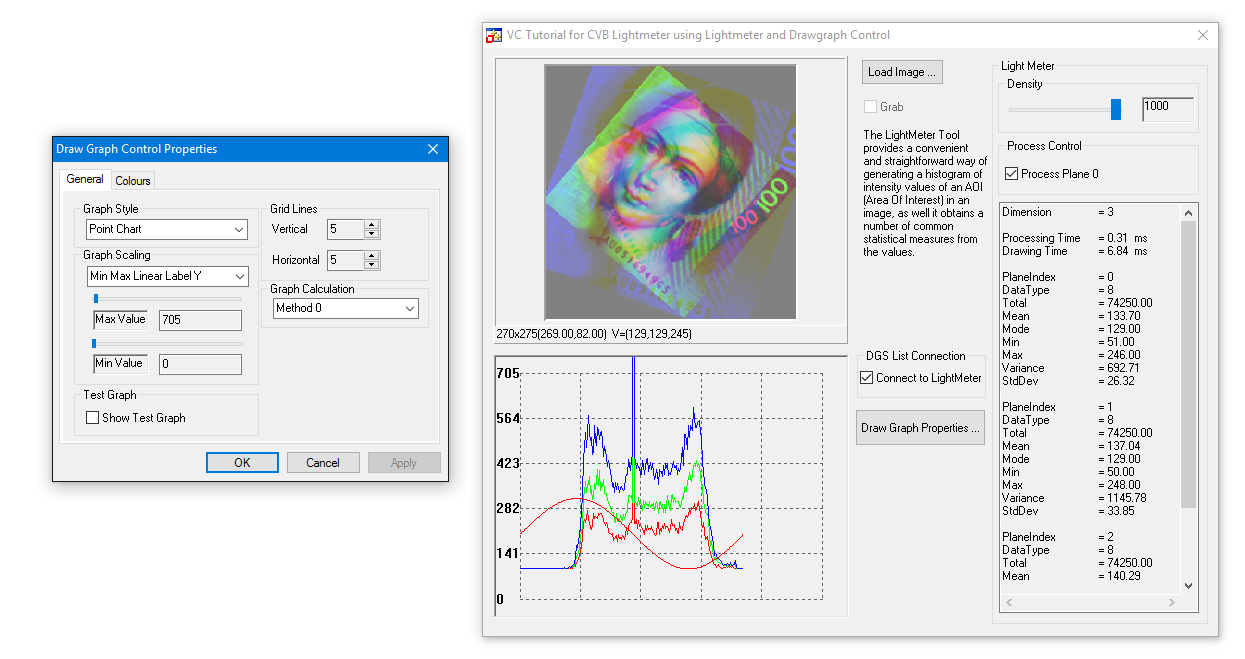
The Property Page of a LightMeter Control (left) and The Main Page of a LightMeter Control (right)
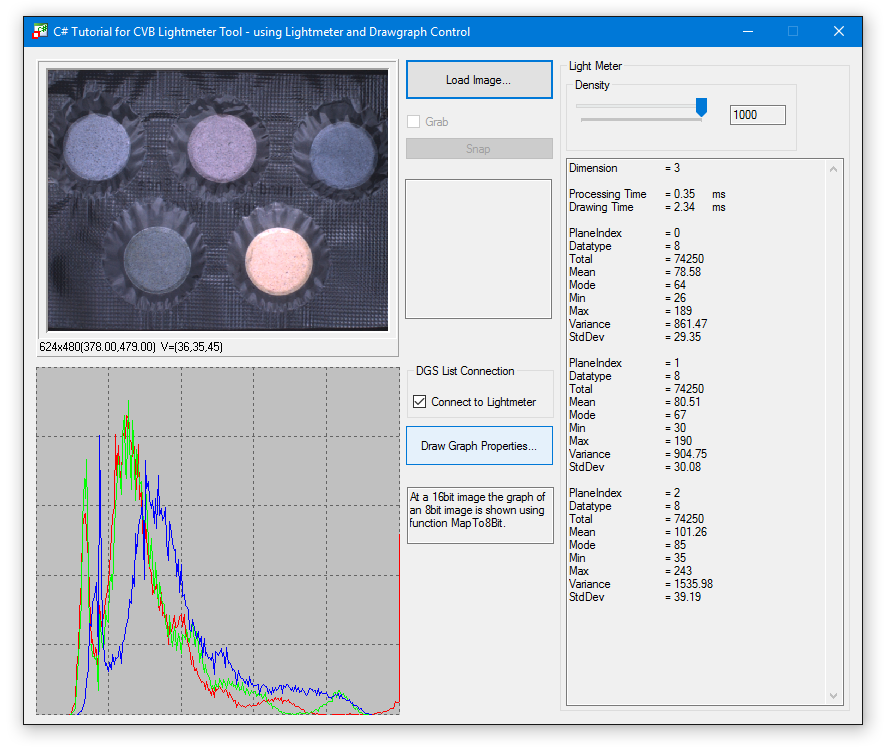
The Main page of the LightMeter Control allows you to change the properties online and have a direct feedback of this changes:
Find example applications under %CVB%Tutorials\LightMeter. Quick and easy analysis of an image using statistical calculations such as mean value, standard deviation, etc. ideally suited for evaluation of object completeness and presence checks, surface inspection (homogeneity, scratches, print, etc.), or the supervision of a camera image in regard to integration time, lighting, etc.
The following images show some example applications the LightMeter Tool can be used for:
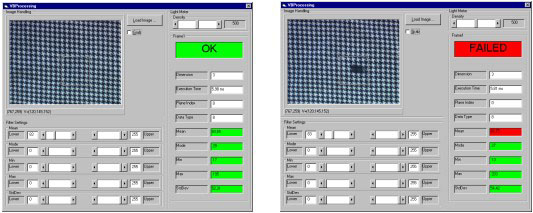
Distortions on fabric
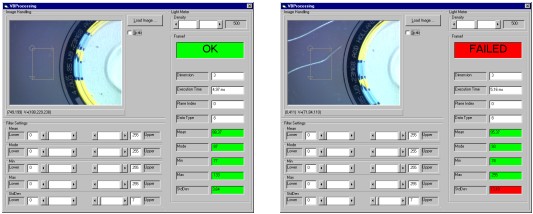
Scratches on CDs
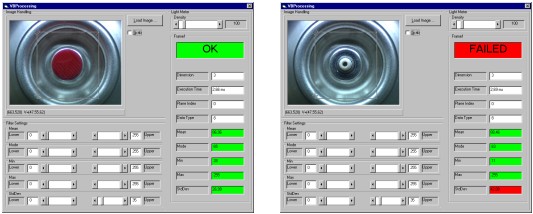
Missing atomizer head
Other applications are blister inspection, print quality inspection, automatic thresholding etc...